
Service 05 — The permanent record
The record that outlives commissioning.
Permanent environmental monitoring for solar, hybrid and grid infrastructure — remote telemetry, hosted delivery, preventive maintenance. Measurement doesn’t end at handover: the record keeps running, quality-controlled, for years.









































This is what a hosted station feels like.
A real atmospheric feed — global horizontal irradiance (GHI), temperature, wind, humidity, pressure and rain — read live in your browser, with three of our four hosted QA checks (range, step, flatline) passing verdicts as you watch. The fourth, drift, needs months of history — it runs hosted. Pick a region, or read your own sky.
LIVEOpen-Meteo model feed · range / step / flatline checks computed live in your browser — a deployed station reads the sky itself
The station that never sleeps.
A permanent 10 m station — cups, vane, shielded temp/RH, pyranometer, rain gauge, solar supply and a telemetry logger. Change the sky. Watch the record keep leaving. Hover any instrument for what it measures.
Storm, grid outage, monsoon week — the station is solar-fed, the logger buffers, telemetry retries. Measurement doesn’t end at commissioning; neither does our duty of care.
How the record is actually made.
From a calibrated sensor to a signed monthly report — every stage has one job and a way to fail safely. Click any element of the chain.
Data logger · the edge
The edge does the arithmetic
An industrial logger samples every second and commits 10-minute statistics — average, minimum, maximum and standard deviation per channel — time-stamped and stored locally for weeks, even if the link dies.
Every stage buffers and retries — a failed link, a grid loss or a lapsed SIM becomes a delay, never a hole in the record.
Break the record. Watch QA catch it.
Raw data isn’t evidence — a drifting sensor lies politely for months. Inject the four classic faults into a clean 48-hour trace and watch the checks flag every one. This is the difference between collected and quality-controlled.
On a live network these flags page an engineer, schedule a swap, and mark the span so it can never quietly poison a performance ratio. The record stays defensible.
Every number a solar asset answers to.
Each channel exists because a contract, a warranty or an O&M decision depends on it. Stations are specified and operated to IEC 61724‑1 monitoring practice, with sensor calibrations traceable and certificates on file.
Irradiance
Pyranometers in the array plane (POA) and horizontal (GHI) — the denominator of every performance-ratio number.
Class A pyranometer · ISO 9060Temperatures
Module backsheet and shielded ambient — the derating story, degree by degree.
PT1000 · ±0.1 °CWind
Cups and vane — tracker stow calls, storm alerts, cooling effects on yield.
First-class cup · 0.1 m/sHumidity & pressure
Dew risk on glass, air-mass corrections, the meteorology behind the model.
0–100 % RH · ±1.5 %Precipitation
Tipping bucket — natural wash-off vs a cleaning bill, and flood alerts.
Tipping bucket · 0.2 mm/tipSoiling & ground
Soiling ratio for the cleaning economics, albedo for bifacial yield claims.
Dual-cell soiling · albedometerWhat you actually get.
Not a brochure promise — a table. Every ten minutes, every channel, four statistics, a QA verdict. This is the shape of the record your analysts, your lender and your O&M contractor will all read from.
| TIMESTAMP | GHIW/m² | T-AMB°C | WSm/s | WD° | RH% | RAINmm | QA |
|---|---|---|---|---|---|---|---|
| 2026-08-25 09:20 | 489 | 30.1 | 3.8 | 206 | 64 | 0.0 | PASS |
| 2026-08-25 09:30 | 512 | 30.4 | 4.1 | 210 | 63 | 0.0 | PASS |
| 2026-08-25 09:40 | 538 | 30.7 | 4.4 | 214 | 62 | 0.0 | PASS |
| 2026-08-25 09:50 | 1391 | 30.9 | 4.3 | 215 | 61 | 0.0 | STEP ✗ |
| 2026-08-25 10:00 | 581 | 31.2 | 4.6 | 219 | 60 | 0.0 | PASS |
| 2026-08-25 10:10 | 604 | 31.4 | 4.9 | 221 | 59 | 0.0 | PASS |
| 2026-08-25 10:20 | 622 | 31.6 | 5.1 | 224 | 58 | 0.0 | PASS |
- Live dashboard — every station, current sky, on any screen
- Alerts to phone and inbox — gust, flood, outage, QA failure
- Raw + cleaned data — CSV export and API, your analysts’ format
- Calibration certificates on file for every sensor, always current
- Monitoring practice to IEC 61724‑1 — the standard your lender’s engineer will test it against
Judged by one number: availability.
A monitoring contract lives or dies on data availability — the share of ten-minute records that arrive, pass QA and land in the archive. Preventive maintenance is what keeps the bars above the line through monsoon, heat and grid outages.
When a lender or an OEM asks “can we trust this record?”, availability is the first page they turn to. We engineer the network so that page is boring.
Built for the weather it reports on.
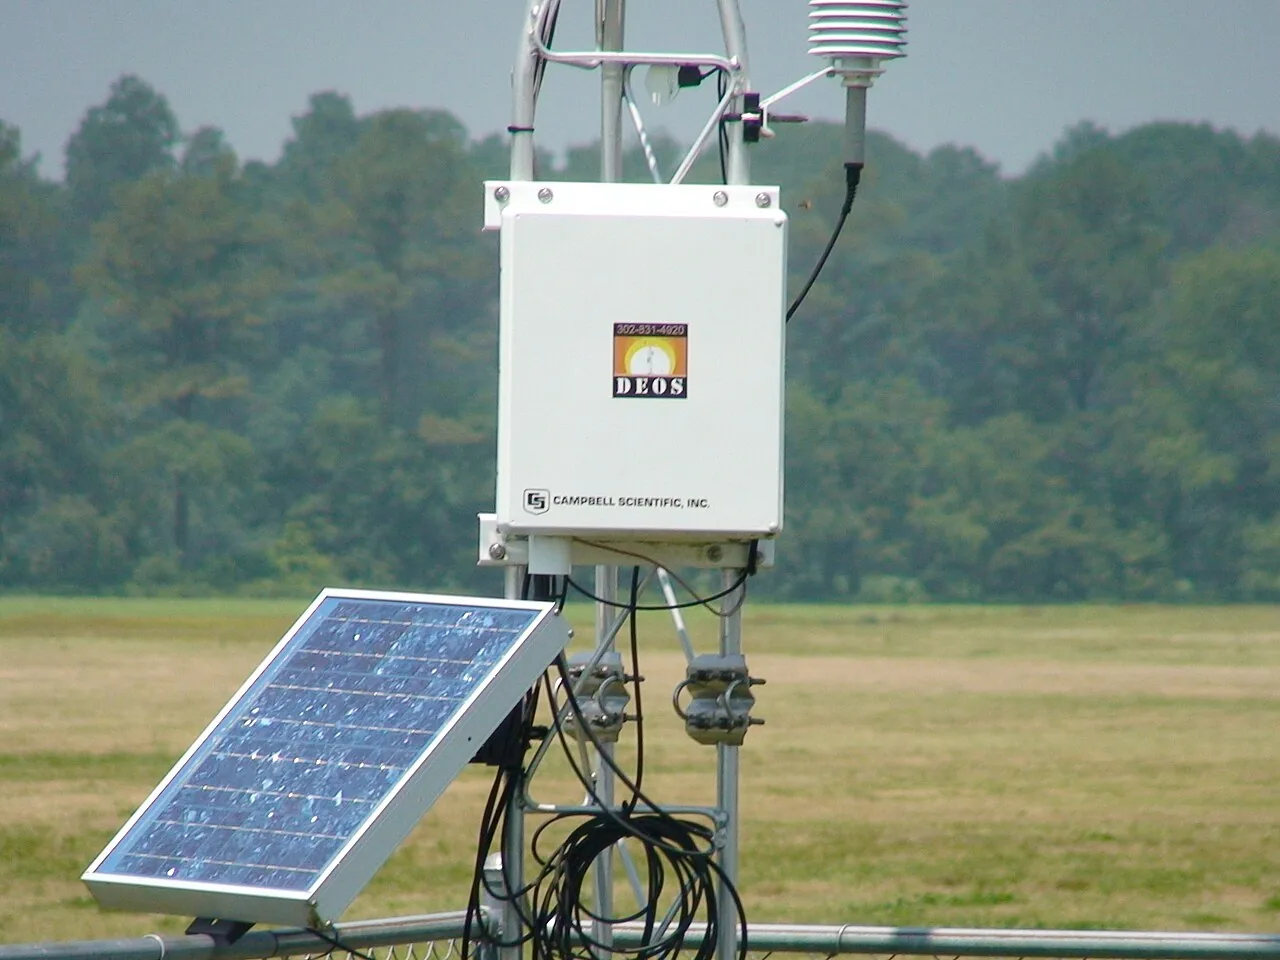
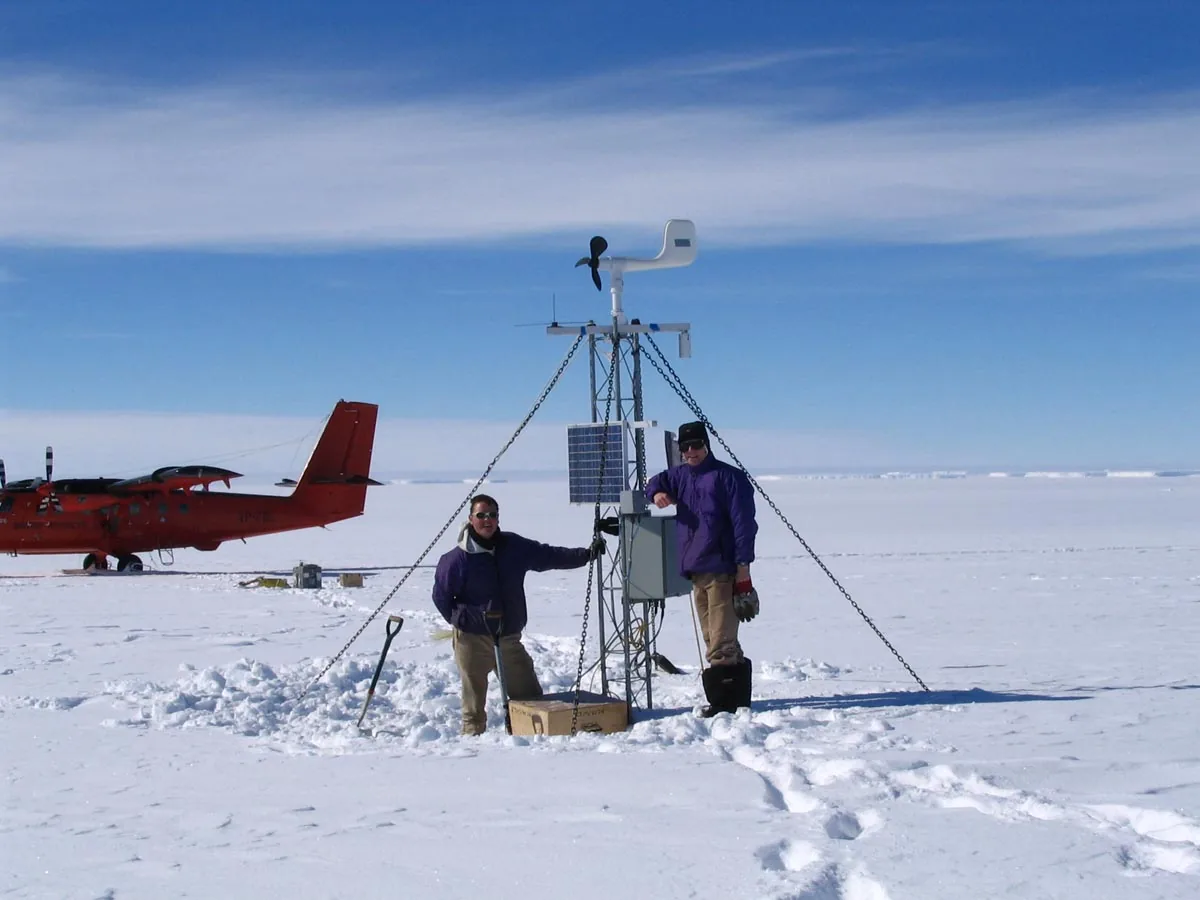
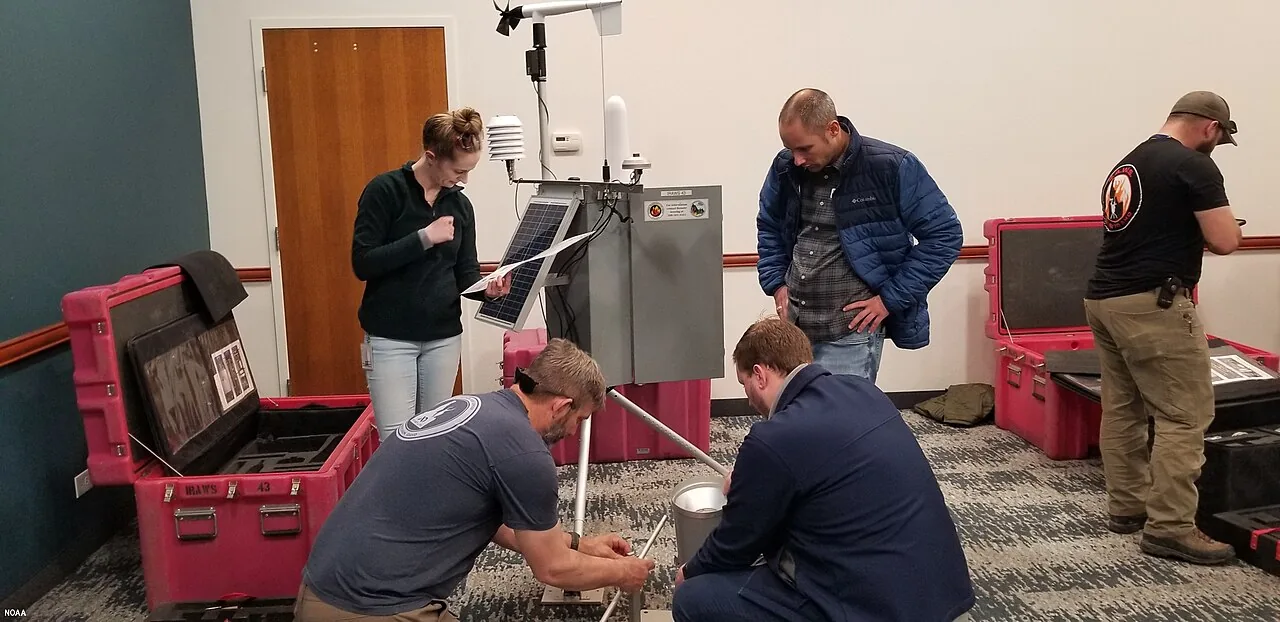
Quality-controlled, not just collected.
Raw data isn’t evidence. The record is only worth what its quality assurance can prove — so assurance is built into the service, not bolted on.
Monitor
Weather, solar and grid quantities measured continuously, in real time, at the asset.
ContinuousAssure
Automated QA flags gaps, spikes and drift; preventive maintenance keeps the network healthy.
QA · preventive O&MDeliver
Hosted delivery means the current record is always one link away — for you and for anyone you need to show it to.
Hosted · real-timeThe durable record
A quality-controlled record for performance, compliance and O&M decisions.
Years, not monthsA monitored network, not a set-and-forget logger
Where is the site — and what must the data prove?
Tell us where the site is and what decision the data has to support. We’ll come back with a measurement scope, a programme and a price.