
Service 03 — The verdict
The curve that
ends the argument.
Independent power performance testing to IEC 61400-12-1. One measured power curve — the same number the OEM, the owner and the lender all read — for warranty close-out, acceptance, upgrade validation and dispute resolution.
Worked example — real campaign results are confidential · method: IEC 61400-12-1 method of bins — each point is the mean of a 0.5 m/s wind-speed bin, density-normalised, with per-bin uncertainty stated









































The measurement chain
The turbine never grades its own homework.
Power is measured independently — class transducers on the turbine’s own CT/VT taps, logged beside an isolated met-mast reference, time-synchronised into one dataset. Click any element of the chain.
Logger-1 · independent
Power, measured by us
A dedicated Ammonit logger records the transducer’s output — high-resolution acquisition, synchronised 10-minute statistics, data integrity checks and remote transfer. Independent of the turbine’s own metering, end to end.
All instruments calibrated and installed to IEC 61400-12-1. The turbine’s own SCADA is used to filter operating states — never as the measurement.
The measurement, in the field
Ground, or from the nacelle.
Both to IEC 61400-12-1 — we choose the method that fits the terrain, the fleet and the question the test must answer. Toggle the method, drag to orbit.
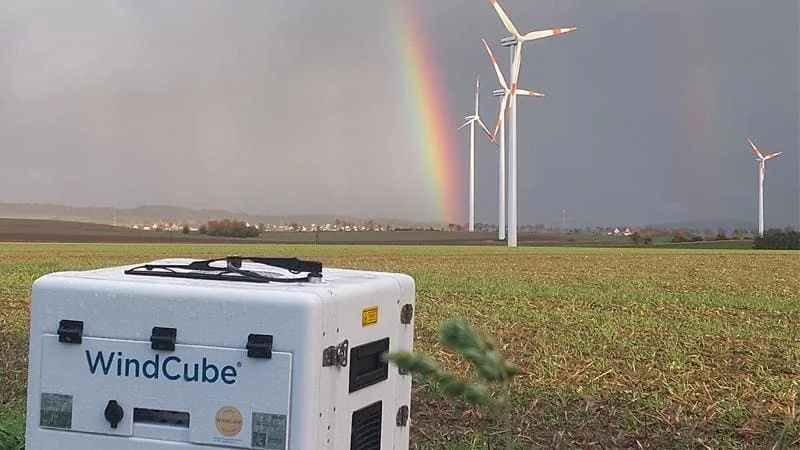
- SeesThe free-stream inflow across the full rotor, from a fixed point 2–4 D upwind (2.5 D shown).
- FitsSingle-machine tests, complex terrain, warranty and acceptance where the free stream is the reference.
- GivesA profiled wind field the standard’s method of bins is built around.
The standard, evolved
IEC 61400-12-1, edition 1 to edition 2.
The method behind every bankable curve was rewritten in 2017. Edition 1 (2005) read the wind at one height — the hub — with a cup anemometer on a mast. Edition 2 (2017) reads the whole rotor, folds shear and veer into a single rotor-equivalent wind speed, and lets a verified LiDAR stand in for the mast. Toggle the edition.
Rotor-equivalent wind speed
The curve is referenced to the wind across the entire swept rotor — not one hub reading — so shear and veer no longer bias the result. The measured curve tracks what the blades actually see.
- Reference height
- Hub height · one height
- Rotor-equivalent · ≥3 heights (REWS)
- Instrument
- Cup anemometer on a met mast, 2–4 D upwind
- Cup, or a classified & verified LiDAR / SoDAR
- Shear & veer
- Unseen — one height can’t read the profile
- Integrated across the swept rotor
- Turbulence
- Not treated
- TI reported · normalisation defined
- Uncertainty
- Category A + B, basic combination
- Expanded — mounting, flow & correlation
Unchanged in both editions — the method of bins · 0.5 m/s wind-speed bins · ≥30 min per bin · ≥180 h total · air-density normalisation · a defined valid measurement sector.
IEC 61400-12-1:2005 → :2017 · the principal changes, in brief — we test to the edition your contract and warranty specify.
Why it holds
A power curve is only worth what it can survive — and ours is built to survive the other side’s engineer.
Why the air matters
Same turbine, different air.
Twelve months of real hourly wind at a southern-India hill corridor — each dot is one hour, plotted as wind shear (10 → 100 m) against hub-height speed and coloured by the hour’s atmospheric stability. Stable nights stack the shear high; convective afternoons collapse it — the same wind speed hits the rotor with a completely different profile, which is why a bankable test filters and bins to IEC 61400-12-1 instead of averaging blindly. Toggle the classes.
Real 12-month window · hover to isolate · click to hide
Stable night air rides high shear — the rotor top sees far more wind than the bottom; convective afternoons mix it flat. A power curve measured without accounting for this blends different machines’ behaviour into one false average. The standard’s answer is discipline: filter, normalise for density, bin by the method of bins — and state the uncertainty per bin.
What the curve decides
A power test moves money.
The gap between the measured curve and the warranted curve is not academic — it is a payment, an acceptance, or a dispute. Which is exactly why the one thing it cannot be is partial.
Close out the guarantee.
The measured curve settles the power-curve warranty at end of term — either the machine met what was sold, or the shortfall is quantified in kWh and defensible against the contract.
Take the asset over.
At handover, an independent power performance test is the evidence acceptance turns on — the owner and the lender sign against a measured curve, not a promised one.
Prove the change — or the claim.
Validate a power-curve upgrade against a measured before-and-after, or resolve a yield dispute with a curve that survives the other side’s independent engineer.
How a campaign runs
Six steps from scope to signed.
Every campaign follows the same disciplined path — from the question the test must answer to a report that stands up in review. No step is skipped, and each one is documented.
Define the question.
Warranty, acceptance, upgrade or dispute — the decision sets the method, the sectors and the acceptance criteria before anything is installed.
Deploy the LiDAR.
Ground-based or nacelle LiDAR, calibrated and traceable, sited to see the free-stream inflow the standard is built around.
Capture the field.
Wind and power logged across the bins, through the valid sector, until every bin holds enough data to be defensible.
Filter, normalise, bin.
Availability and status flags applied, air density normalised, power binned by the method of bins — strictly to IEC 61400-12-1.
State the result.
The measured curve, its uncertainty and AEP against the warranted curve — with every deviation from the method logged and justified.
Survive the review.
The report goes to the independent engineer and holds — the one number the OEM, the owner and the lender all sign against.
The impartial arbiter
Three parties. One curve.
Because we hold no position in the outcome, everyone at the table works from the same measured number. That is what turns a test from the start of an argument into the end of one.
Wants the machine defended.
Reads the same curve, tested to the same method — a result it can stand behind, or dispute on the standard, not on our allegiance.
Wants the truth of the asset.
Sees measured yield against the curve that was sold — the basis for acceptance, warranty and every model downstream.
Wants certainty to bank on.
The independent engineer (IE) reviews a report built to survive scrutiny — uncertainty stated, deviations justified, compliant line by line.
To the standard, or it isn’t a test
IEC 61400‑12‑1, line by line.
The standard is exact about sensors, siting, sectors and filtering. We test to it precisely and document every deviation and its justification — so the result is defensible point by point, not just a plausible curve.
Where is the turbine — and what must the curve prove?
Tell us the machine, the site and the decision the test has to support — warranty, acceptance, upgrade or dispute. We come back with a measurement scope, a programme and a price.
Offices, channels & the enquiry composer →
Independent · IEC 61400-12-1 · bankable reporting