Yaw error
Nacelle LiDARUp to 60% of turbines run misaligned (industry estimate)
The nacelle points degrees off the true wind — and holds it for years. cos³·⁵ of that angle comes straight off the output.

Service 04 — The recovered margin
Nacelle LiDAR diagnostics converted into yaw correction and wake steering — the gain verified by re-measurement, never assumed. Finding and recovering lost energy across operating wind fleets.
AEP gain on the fleet’s best machine, re-measured after correction — the worst still gained +1.66%.
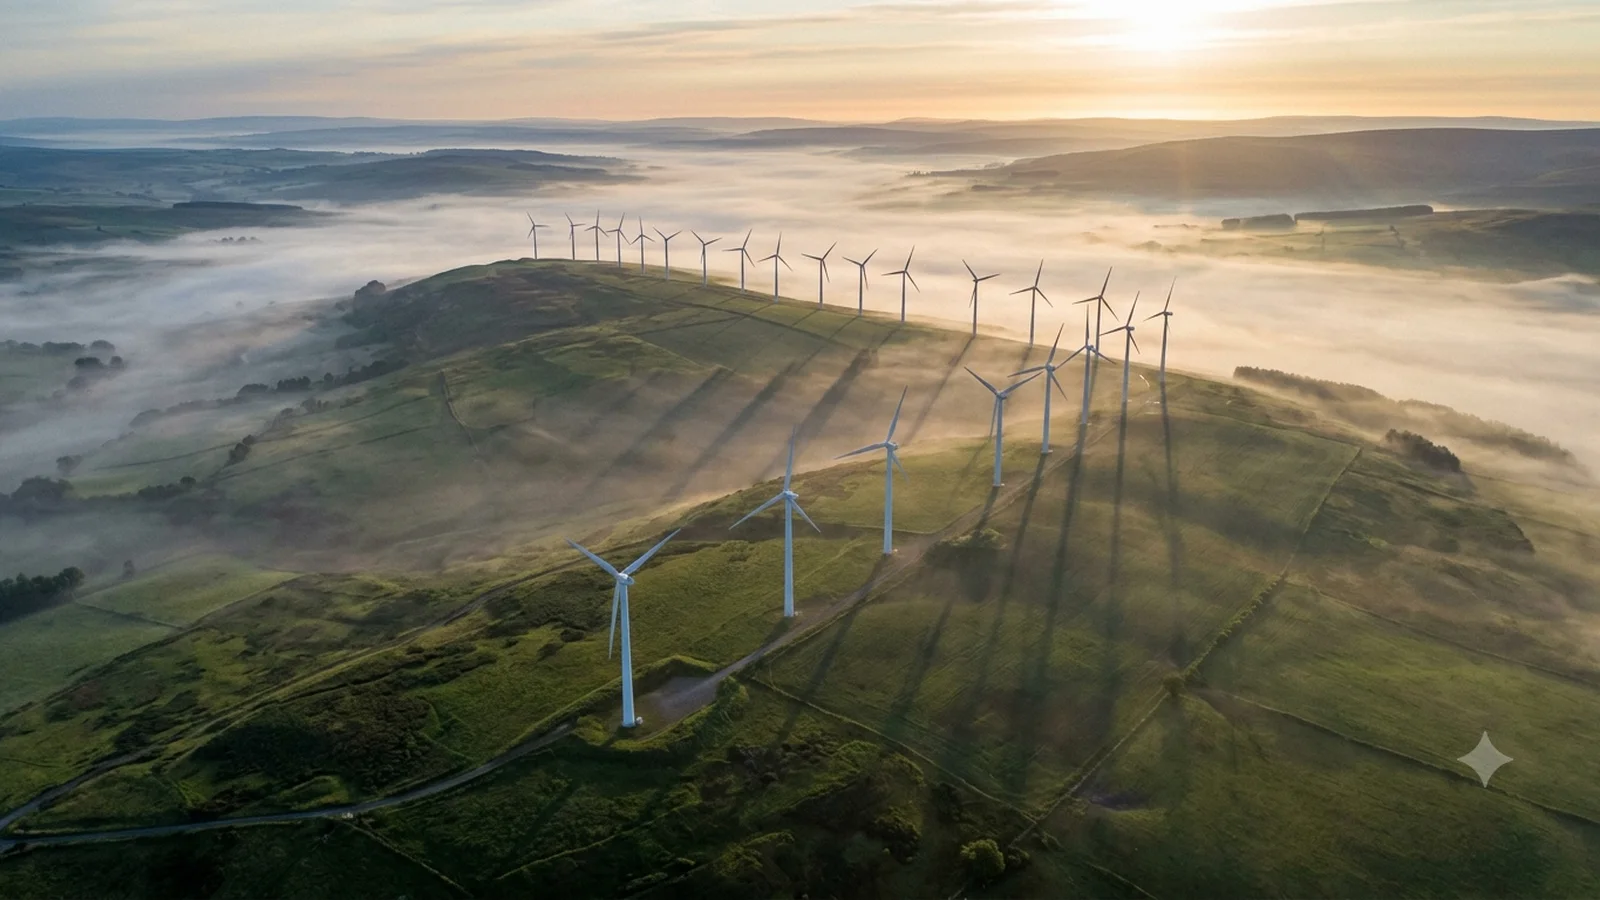 The fleet · wakes written in the mist









































A turbine’s wake can cost the machine behind it double-digit output. A small, deliberate yaw offset on the front row pushes that wake aside — trading a sliver on the leaders for a lot on the followers. Flip the switch, drag to orbit — and click any machine for its measured record.
On a real 6.3 MW fleet we corrected −5.6° to −9.0° of static misalignment and converted the diagnosis into exactly this strategy — the gain re-measured at +1.66% to +3.36% AEP, payback inside two months.
Power falls with cos³·⁵ of yaw error — the exponent our campaigns fit — so a handful of quiet degrees is real money, every year. Set your fleet and see. Then remember: on a campaign, we don’t model this number — we measure it.
Illustrative — cos³·⁵ model as fitted on campaign data, capacity factor assumed 40%. On the campaign above, −5.6° to −9.0° of misalignment came back as +1.66% to +3.36% AEP once corrected — re-measured, not modelled.
Yaw is only the loudest one. The same instrumented campaign reads five more failure modes — each one measured on the operating machine, each one a number before it becomes a work order.
Up to 60% of turbines run misaligned (industry estimate)
The nacelle points degrees off the true wind — and holds it for years. cos³·⁵ of that angle comes straight off the output.
Up to 90% of turbines sit in disturbed flow (industry estimate)
Wake-churned inflow, read as turbulence intensity per direction — the measurement the wake-steering strategy is built from.
Up to 25% of turbines pitch-misaligned (industry estimate)
Blade-angle differences between the three blades bend the power curve and load the drivetrain on every rotation.
Heading vs true north, per machine
A heading error shifts every directional curtailment sector — noise, shadow and load sectors all fire in the wrong wind.
Blade-to-blade weight difference
Grams off on one blade become vibration at the hub — fatigue in the bearings and gearbox long before it shows in AEP.
Tower & foundation condition
The structure’s natural frequency is a fingerprint — when it drifts, the tower or the foundation is telling you something.
One campaign · one instrument set on the operating machine · six verdicts, each a number · industry estimates above; your fleet is measured, not assumed
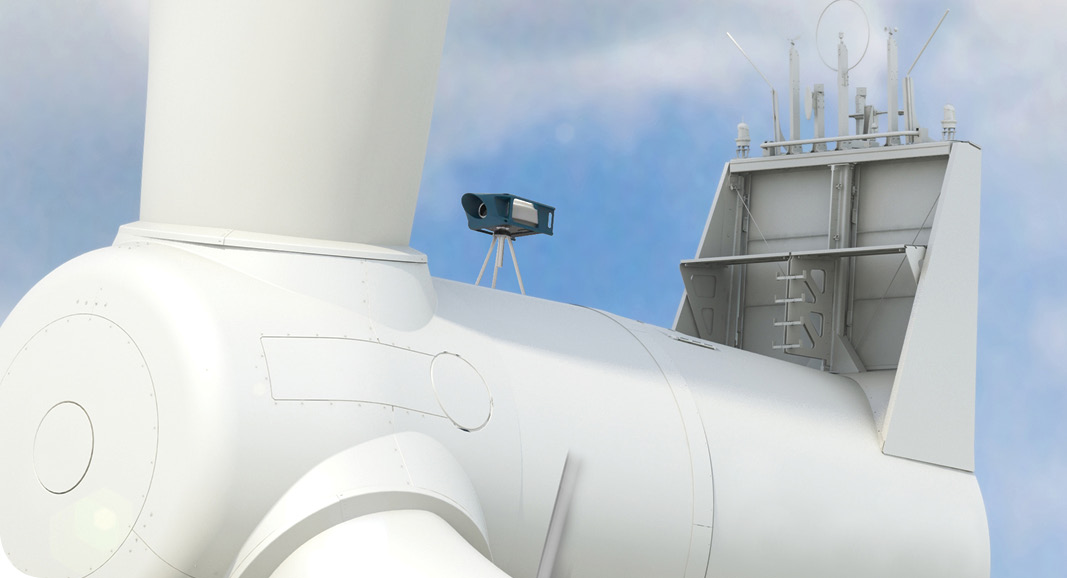
A yaw controller can drift several degrees off true over time, quietly shaving AEP. Nacelle LiDAR looks upwind and measures the real inflow, so the misalignment is a number, not a hunch — turbine by turbine.
Nacelle LiDAR looks upwind and measures the true inflow ahead of the rotor — static yaw misalignment, veer and turbulence, per turbine.
Static yaw offsets and a wake-steering strategy, applied across the fleet — the diagnosis converted into an operating change.
The AEP gain is re-measured after the change — verified, never modelled. The number you act on is the number the fleet actually produced.
A yaw correction doesn’t move the rated plateau — it lifts the knee. The gain lives between cut-in and rated, exactly where a fleet spends most of its operating hours. The shaded band is the +1.66% to +3.36% per machine that the corrected fleet was re-measured at.
This is why yaw is the cheapest energy a fleet can buy: no new hardware on the rotor, no loads penalty at rated — just the machine finally facing the wind it was sold to face.
The instrument programme behind it (Epsiline)
One corrected fleet is a result. Three hundred instrumented farms are a method.
Tell us where the site is and what decision the data has to support. We’ll come back with a measurement scope, a programme and a price.