
Service 06 — The ground truth
The ground truth a wind farm is built on.
Centimetre-class terrain intelligence — turbine and access-road design, earthwork quantities before they’re priced, construction verification. Drone-borne LiDAR, processed to a bare-earth digital terrain model.
Terrain models · Earthwork volumes · CAD & GIS









































Watch the ground truth get captured.
A survey drone flies its planned lines and the point cloud materialises in its wake — banded by elevation like the finished sheet. Then the classification that matters: toggle away the vegetation and you are looking at the bare earth the engineers actually design on. Drag to orbit, hover or tap anything.
The green stays in the surface model; the design happens on the bare earth. That classification — done properly, checked against ground control — is the difference between a picture and a terrain model.
A billion pulses. One defensible model.
Raw LiDAR is not a terrain model — it becomes one through a chain where every step is logged and checkable. Click any element.
Classify · the judgement call
Ground is decided, not assumed
Every return is classified — bare ground, vegetation, structures — by algorithm first, then reviewed by a surveyor where the terrain is difficult. The bare-earth model is only as good as this step.
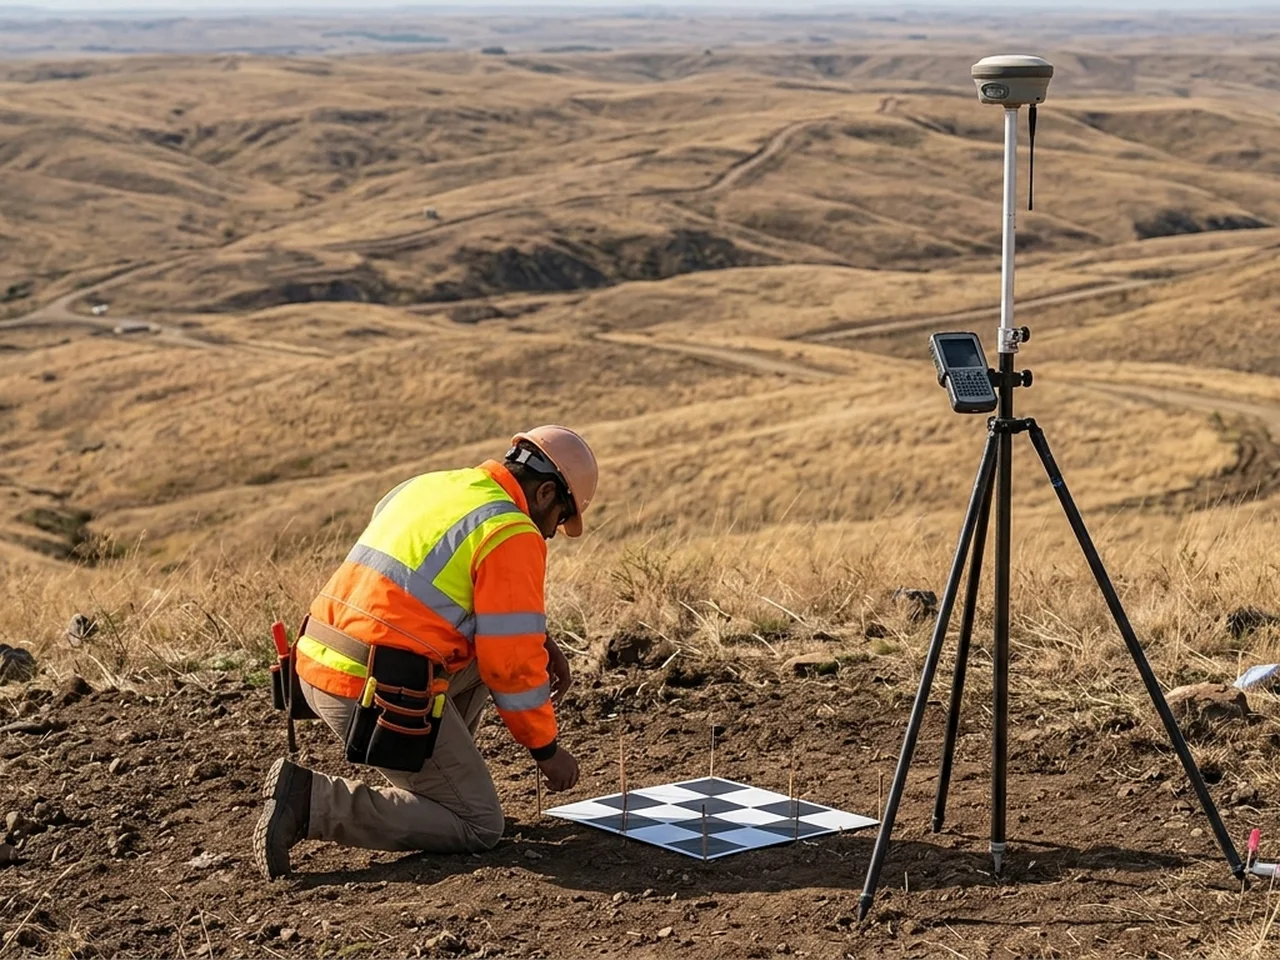
The base station and the checkpoints are surveyed independently of the flight — the model is positioned by one and judged by the other.
Before the drone flies, the flight is planned.
The drone covers the site in straight passes, like mowing a lawn. Three settings decide how many laser points land on every square metre: how high it flies, how fast, and how much each pass overlaps the last. More points means more detail under trees and contours you can build from; too many means batteries and hours you pay for. Move the settings and watch the trade-off.
Lower means more points per square metre, but narrower passes, so more of them.
Slower means more points, but a longer flight.
More overlap means no gaps between passes, at the cost of extra passes.
Our rule: at least 100 points per square metre for 0.5 m contours and reliable ground under scrub; under dense trees we fly lower or slower. The flight plan is delivered with the survey, so the point density can be checked, not taken on trust. The arithmetic assumes a 240,000-pulse-per-second scanner, about 1.5 returns per pulse, a 70° field of view and 16 minutes of usable battery per flight.
Drag the design grade. Watch the earthworks bill move.
An access-road corridor over real measured relief. Set the grade and the corridor width — cut and fill volumes update as you move, and the balance point shows where hauling stops. This is the arithmetic a tender should be built on.
Cut you can re-use as fill is nearly free; everything else is hauled and paid for twice. Finding the grade that balances is the cheapest optimisation on the project — and it needs a terrain model you can trust.
Where the site will actually let you build.
Every layout decision answers to slope — crane pads want near-flat ground, access roads have grade limits, blade transport needs swept corners. Set your slope limit and watch the buildable envelope change on real upland relief — open 30 m terrain data for any site you enter here; a live survey computes the same map from the cm-grade DTM.
Enter a site — or press Read with the sample 14.16, 76.36 (Chitradurga wind district)
This map exists the day after the flight. Micrositing against it — not against a 90 m public DEM — is how layouts stop dying in detailed design.
Centimetre-class is a claim. Residuals are evidence.
Every survey is checked against ground control the model never saw. The residuals — how far the cloud sits from surveyed truth at each checkpoint — ship with the delivery, so “cm-class” is a table, not an adjective.
An earthworks tender priced off a bad model fails expensively and late. This sheet is how you know before you dig.
The pulse that comes back last.
A camera reconstructs what it can see — the top of the canopy. A LiDAR pulse splits into echoes: leaves first, branches next, and last of all the ground. Bare earth under vegetation is not an enhancement; it is the physics of the instrument.
What actually lands in your inbox.
Not “data” — files, named and versioned, in the coordinate system your project runs on, that open in the tools your engineers already use.
| FILE | FORMAT | SIZE | OPENS IN |
|---|---|---|---|
| site_cloud_v2.laz | LAS 1.4 · classified | 18.2 GB | TerraScan · CloudCompare |
| dtm_0p5m_v2.tif | GeoTIFF | 1.1 GB | QGIS · Civil 3D |
| dsm_0p5m_v2.tif | GeoTIFF | 1.3 GB | QGIS · Global Mapper |
| contours_0p5m_v2.dwg | AutoCAD · SHP | 340 MB | Civil 3D · ArcGIS |
| ortho_5cm_v2.tif | GeoTIFF · RGB | 6.4 GB | Any GIS |
| volumes_report_v2.pdf | PDF · signed | 4 MB | The tender meeting |
| residuals_gcp_v2.csv | CSV | 6 KB | Page one of the review |
Designed against measured relief, not a coarse DEM.
Layout, access roads and earthworks all sit on the terrain. Drone LiDAR gives a centimetre-class model of the real ground — under vegetation, across the whole site.
Turbine micrositing
Each position sits on measured ground — the relief, the slopes and the buildable envelope are known before the layout is committed.
- Measured relief, whole site
- Bare-earth — under vegetation
- Centimetre-class point clouds
Roads & crane pads
Access-road grades and crane-pad platforms designed against the real slopes — not discovered against them during construction.
- Road grades on measured slopes
- Crane-pad platform design
- Contours from the DTM
Drainage & earthworks
Drainage and earthwork planning from the same terrain model — with cut-and-fill volumes computed before they are priced.
- Drainage planned on real relief
- Cut & fill volumes up front
- Tender on measured quantities
Quantities before they’re priced.
The expensive surprises on a wind project are in the earthworks. With a measured terrain model we compute cut-and-fill volumes up front, so the tender is built on real quantities — and we re-fly at construction stage to verify what was actually moved.
Capture
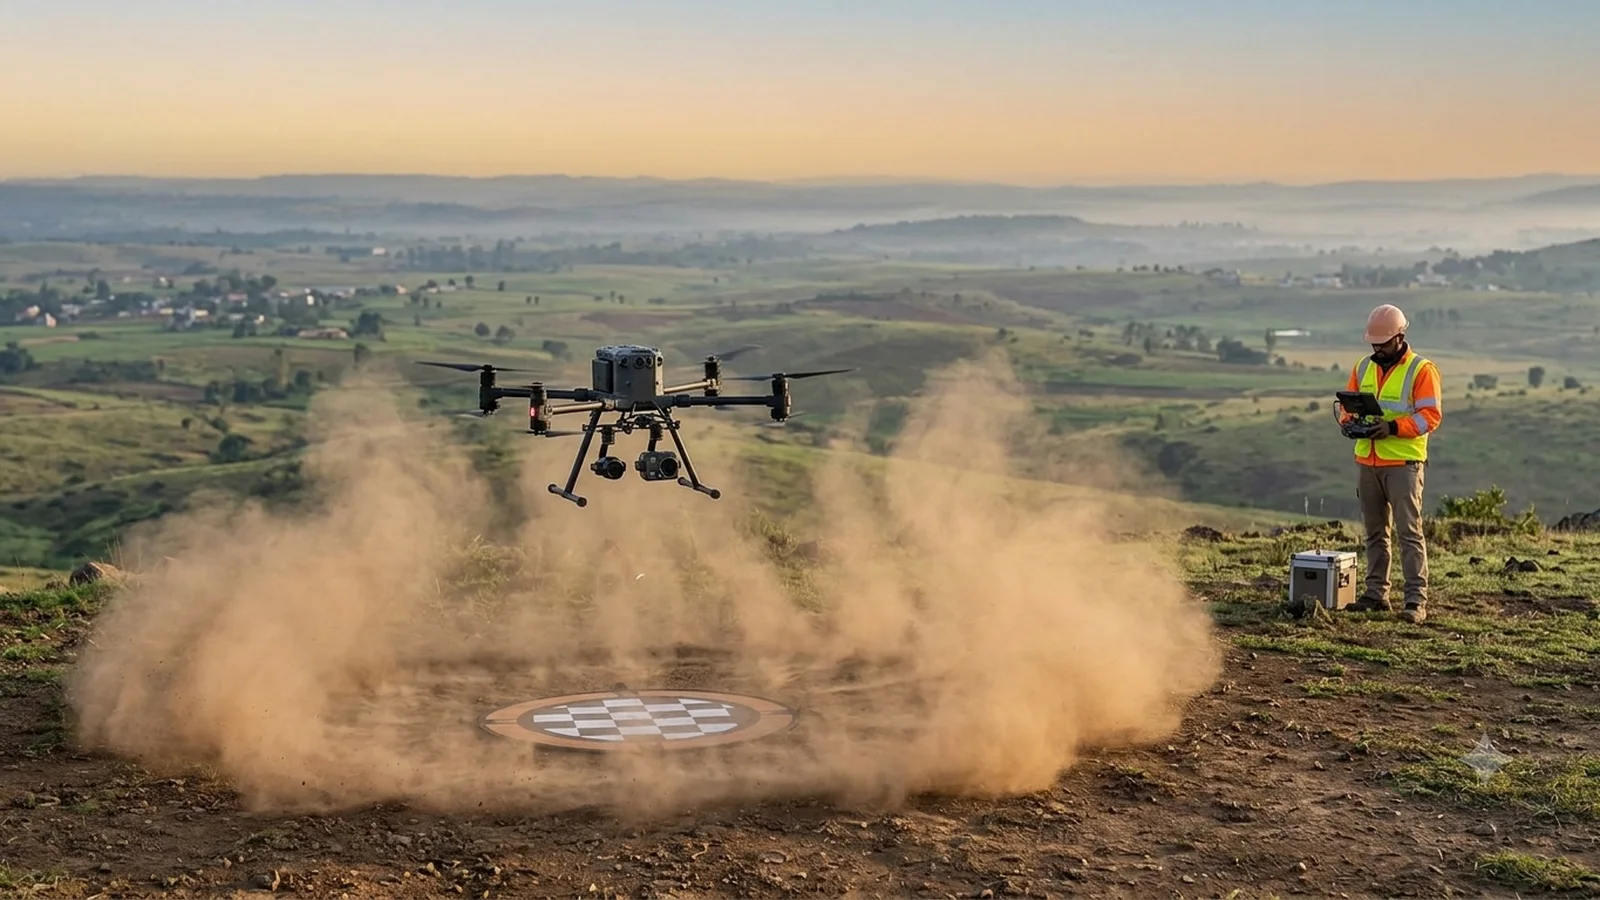
Drone-borne LiDAR captures centimetre-class point clouds — under vegetation, across the whole site.
Drone LiDARModel
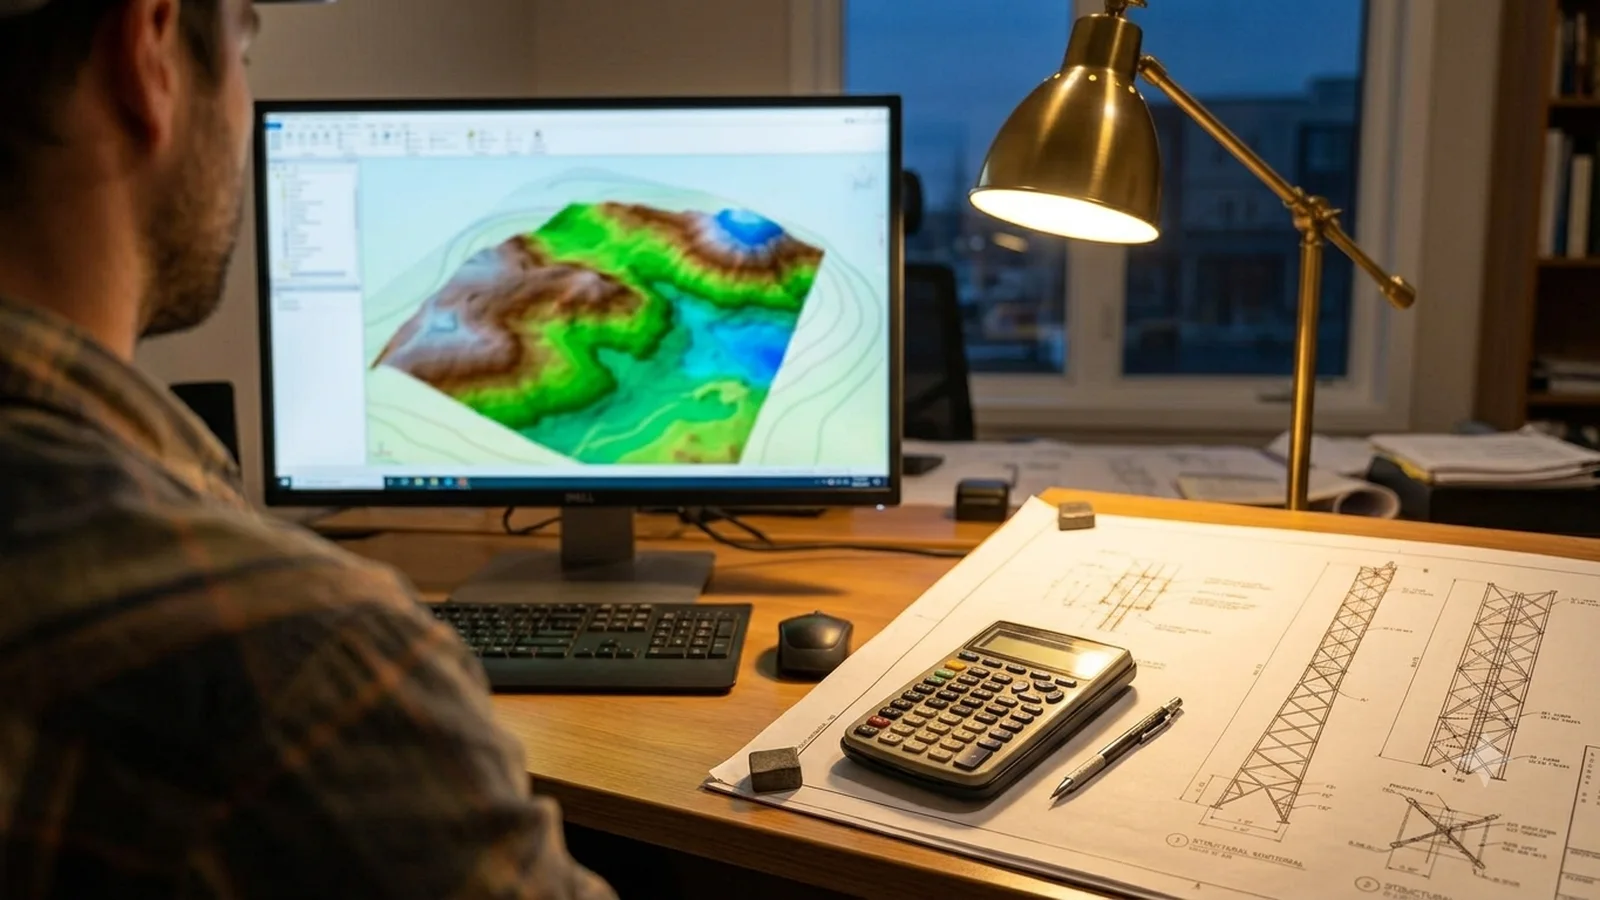
The point cloud is processed to a bare-earth digital terrain model with contours.
DTM · contoursCompute
Cut-and-fill volumes computed against the design — the tender number is measured, not estimated.
Earthwork volumesDeliver & verify
DTMs, contours and volumes in CAD and GIS formats — and a construction-stage re-fly to verify what was moved.
CAD · GIS · re-flyDeliverables: DTMs · contours · volumes · CAD & GIS · construction verification
From the air, to the desk, to the ground.
The unglamorous part — handled
A survey that can’t legally fly, or can’t prove where it stood, isn’t a survey.
Where is the site — and what must the data prove?
Tell us where the site is and what decision the data has to support. We’ll come back with a measurement scope, a programme and a price.